Setting Up Performance Monitoring
We have tools such as SNMP, Nagios, and so on to monitor bare metal, VM performance. Similarly, there are a few tools/plugins available to monitor container performance such as cAdvisor (https://github.com/google/cadvisor) and Prometheus (https://prometheus.io). In this recipe, let’s see how we can configure cAdvisor.
Getting ready
Perform the following to set up cAdvisor:
- The easiest way to run cAdvisor is to run its
docker container, which can be done with the following command:
$ sudo docker container run \ --volume=/:/rootfs:ro \ --volume=/var/run:/var/run:rw \ --volume=/sys:/sys:ro \ --volume=/var/lib/docker/:/var/lib/docker:ro \ --publish=8080:8080 \ --detach=true \ --name=cadvisor \ google/cadvisor:latest- If you want to run cAdvisor outside Docker, then follow the instructions given on the cAdvisor home page: https://github.com/google/cadvisor/blob/master/docs/running.md#standalone.
How to do it…
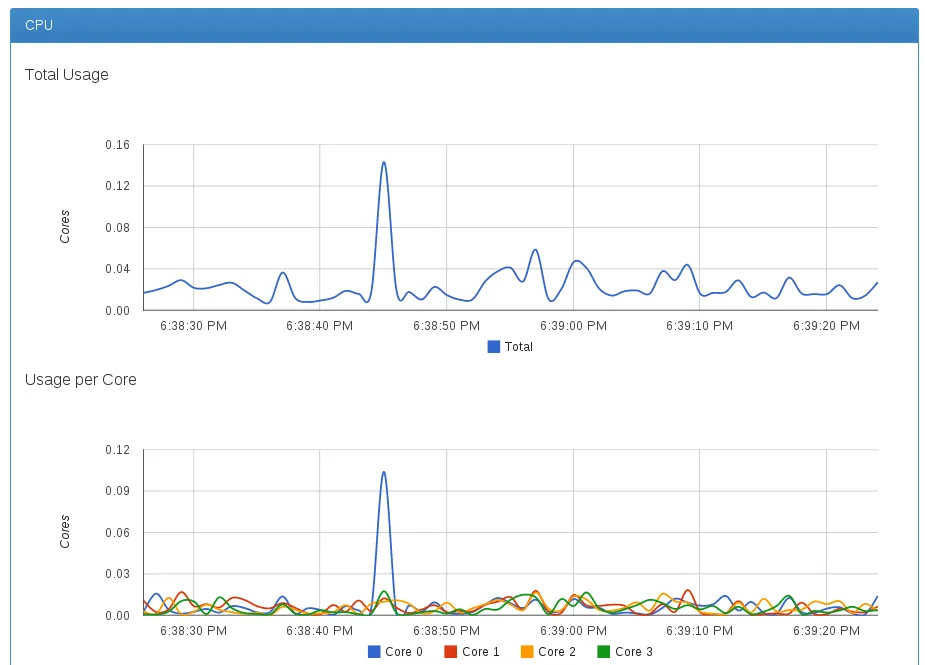
After the container starts, point your browser to http://localhost:8080 . You will first get graphs for CPU, memory usage, and other information for the host machine. Then, by clicking on the Docker Containers link, you will get the URLs for containers running on the machine under the Subcontainers section. If you click on any one of them, you will see the resource usage information for the corresponding container. The following screenshot shows one such container:
How it works…
With the docker run command, we have mounted a few volumes from host machines in read-only mode. cAdvisor will read the relevant information from those, such as Cgroup details for containers, and show them graphically.
There’s more…
cAdvisor supports exporting performance matrices to influxdb (https://www.influxdata.com ).
See also
You can look at the matrices used by cAdvisor from Cgroups in the documentation on the Docker website: https://docs.docker.com/config/containers/runmetrics/.