Visualizing The Image Hierarchy
Docker provides multiple commands to learn about its images in a textual format. However, a picture is worth a thousand words, so it is imperative that we can visualize the image hierarchy through graphs. While Docker doesn’t support any image visualization tool, numerous solutions are available to visualize the image hierarchy. In this recipe, we will visualize the image hierarchy using a nate/dockviz container and Graphviz .
Getting ready
Before we begin, we need one or more Docker images on the host to be running a Docker daemon. We also need to ensure that Graphviz is installed.
How to do it…
Run the nate/dockviz container by supplying images --dot as a command-line argument and pipe the output to the dot ( Graphviz ) command, as shown in the following code, to generate the image hierarchy:
$ docker run --rm \
                 -v /var/run/docker.sock:/var/run/docker.sock \
                 nate/dockviz \
                 images --dot  | dot -Tpng -o images-graph.png
The following is a graphic view of the images in the Docker host:
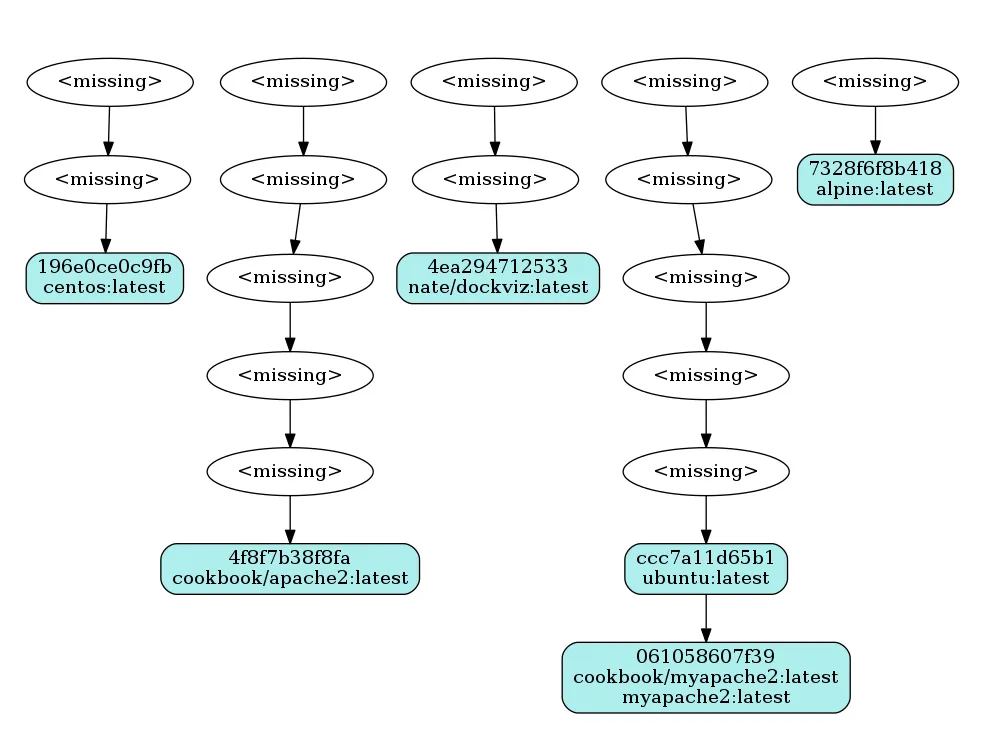
Here, in the graphic view, nodes with <missing> are layers within an image.
How it works…
The nate/dockviz tool is written in go , and iterates through the Docker images’ metadata and generates a Graphviz dot output that is converted to a png image using Graphviz .
There’s more…
You could also use nate/dockviz to visualize the dependency between linked containers. The following is the command for visualizing the container dependencies:
$ docker run --rm \
                 -v /var/run/docker.sock:/var/run/docker.sock \
                 nate/dockviz \
                 containers --dot  | dot -Tpng -o containers-graph.png
See also
- The documentation on
nate/dockerviz: